COVID dashboard will help regions to understand local statistics
COVID-19 data will now be easily accessible to people with visual impairments thanks to a team of highly skilled technology volunteers from the Scottish Tech Army.
The project, which is the first of its kind in the world, forms part of the new Scottish COVID-19 dashboard launched this month and uses data sonification to convert visual timeline data into notes of various pitches. These notes create auditory graphs that will help convey current COVID-19 data to users with visual impairments.
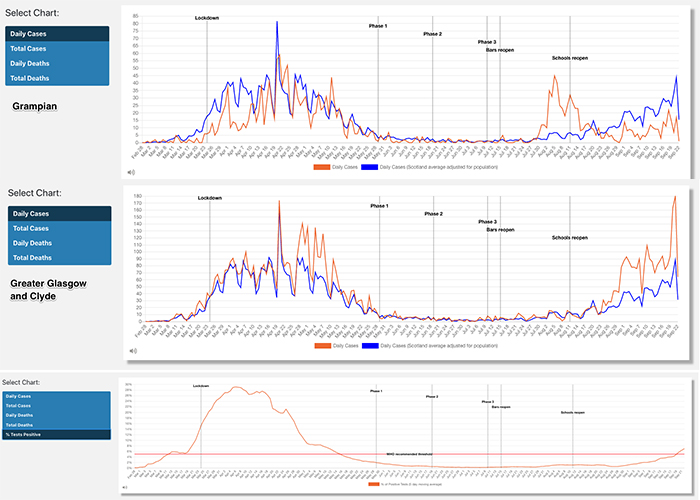
The sonification technique is a new element in the publicly accessible dashboard presenting Scotland’s most current COVID-19 data. The tool will allow users to more easily track and understand the situation in their local area, then make informed decisions about their movements, behaviours and businesses in line with wider government advice.
The dashboard updates daily using data made available by the Scottish Government and the NHS under their open data initiatives. It is compatible with screen readers, and incorporates high resolution colour contrast, heat maps and key graphs to track and display infection rates.
The Scottish Tech Army (STA) was founded by entrepreneurs Alistair Forbes and Peter Jaco in the early stages of lockdown. The STA connects Scotland’s deep pool of tech professionals with projects that harness digital innovation to create solutions to the wide-ranging challenges posed by COVID-19 and to support the recovery and rebuild process from the effects of the pandemic.
One such individual is Eirini Kominou, an STA volunteer, who helped integrate data sonification into the dashboard. Eirini recently completed her PhD in machine learning and data at the University of Strathclyde and is visually impaired so she knows how valuable this tool will be for those with accessibility needs.
She said: “Most scientific data sets are communicated with the support of visual representations such as graphs. This poses significant problems for many people who cannot easily read data in this format. Sonification has seen some early use in fields like astronomy and geoscience to present and analyse complex data sets. However, using it in the dashboard will bring the technique to the wider public for the first time.
“We hope the dashboard will be widely used in Scotland to help individuals to more easily interpret the wealth of statistics and data currently circulating. Due to its regional focus and up-to-date data, we believe this tool will allow individuals to make informed decision based on the specific situation in their local area. However, as the field of data science develops, it is important that we are actively assessing and continually evolving how best to present findings, in line with accessibility needs.”
The dashboard developed out of a challenge set by STA organisers. Volunteers were asked to take the open source COVID-19 data provided by the Scottish Government and develop a way of presenting it that would be easier for the people to use and understand.
The process was also designed to support the professional development of less experienced volunteers which, co-founder Alistair Forbes explains, is a founding principal of the STA.
Alistair said: “When we set up the Scottish Tech Army at the beginning of lockdown, it was with the aim of mobilising the exceptional talent within our technology sector to tackle emerging issues related to COVID-19.
“However, we also have a particular focus on giving new and emerging talent an opportunity to gain hands-on experience when delivering solutions. The dashboard challenge has taken our volunteers through a full project lifecycle, equipping them with professional know-how to complement their existing technical skills.
“When we set the volunteers the challenge of making the Scottish COVID-19 data more accessible, we knew they would come up with excellent ideas to help users visualise the information. However, they have gone even further by assessing and meeting the needs of visually impaired users.
“Globally, this is something that no-one else is prioritising when communicating the science on COVID-19. Our team is breaking new ground and, importantly, establishing a precedent for how we address accessibility in data science moving forward.”